Highlights from April: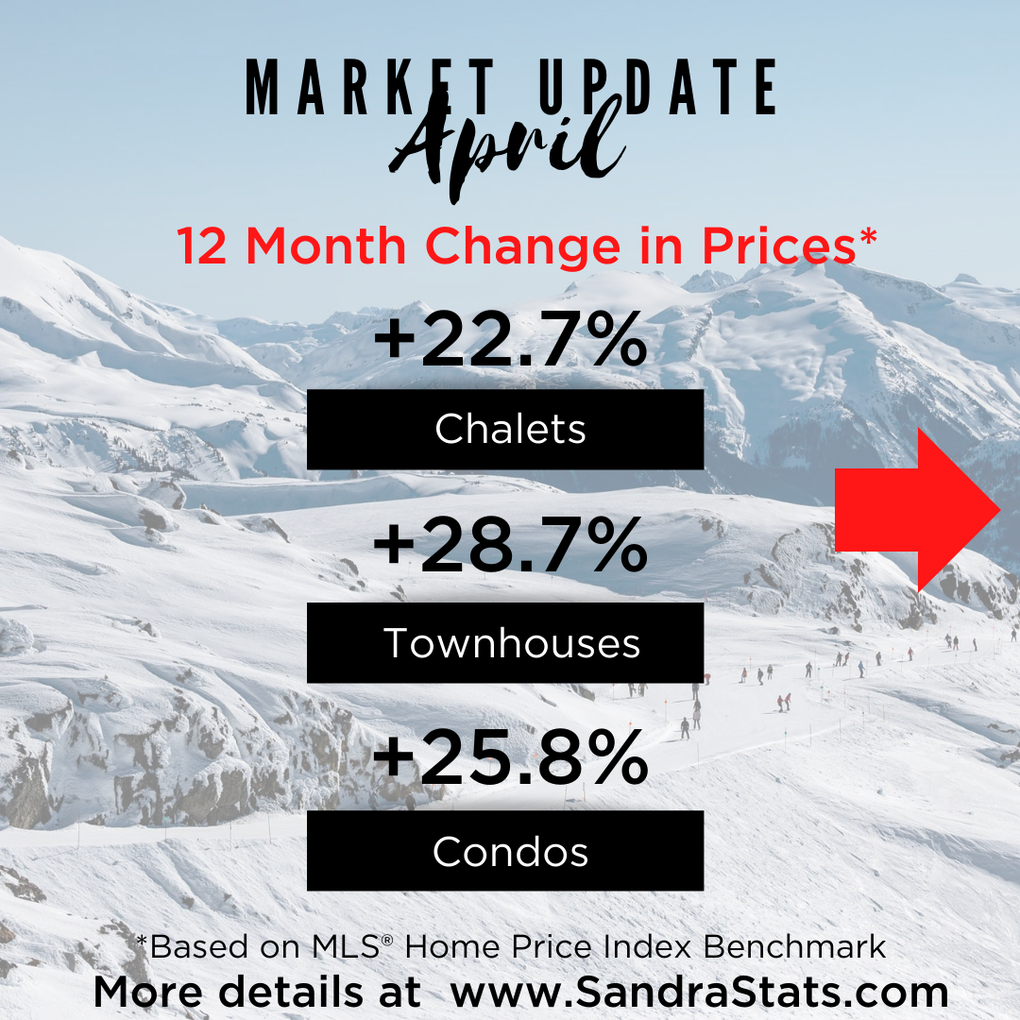
PRICE Change:
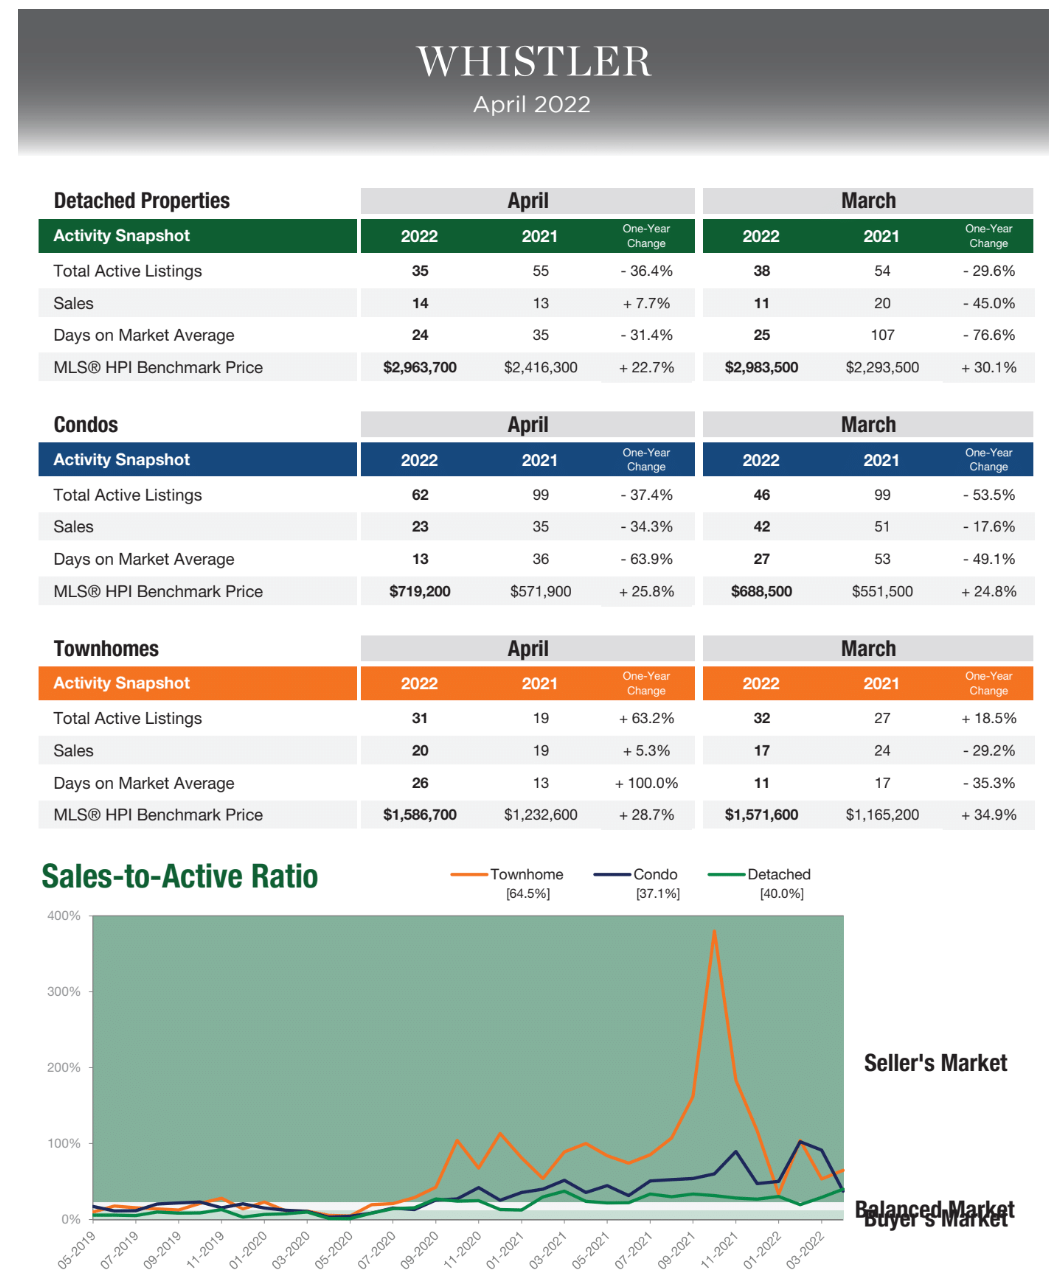
12 Month increase in PRICES remains strong ranging from 22% - 29% across all property types. This is based on the MLS Home Price Index Benchmark.
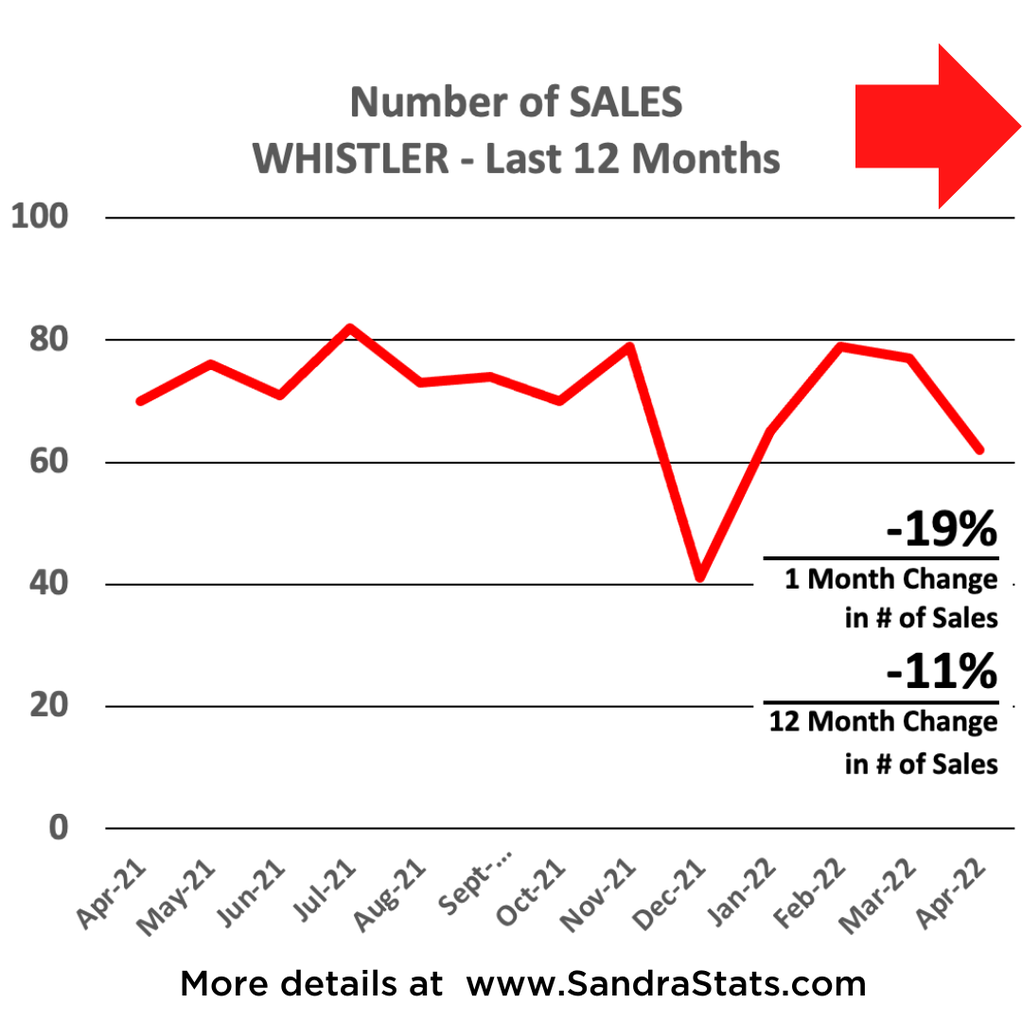
Number of Sales:
Number of SALES saw a decrease over last month by 19%. If you look at the chart you'll see there is no trend indicating a consistent decrease in sales volume over the last 12 months. In addition the number of new listings dropped last month as well therefore having less of an impact on the Sale to Active Ration (explained below).
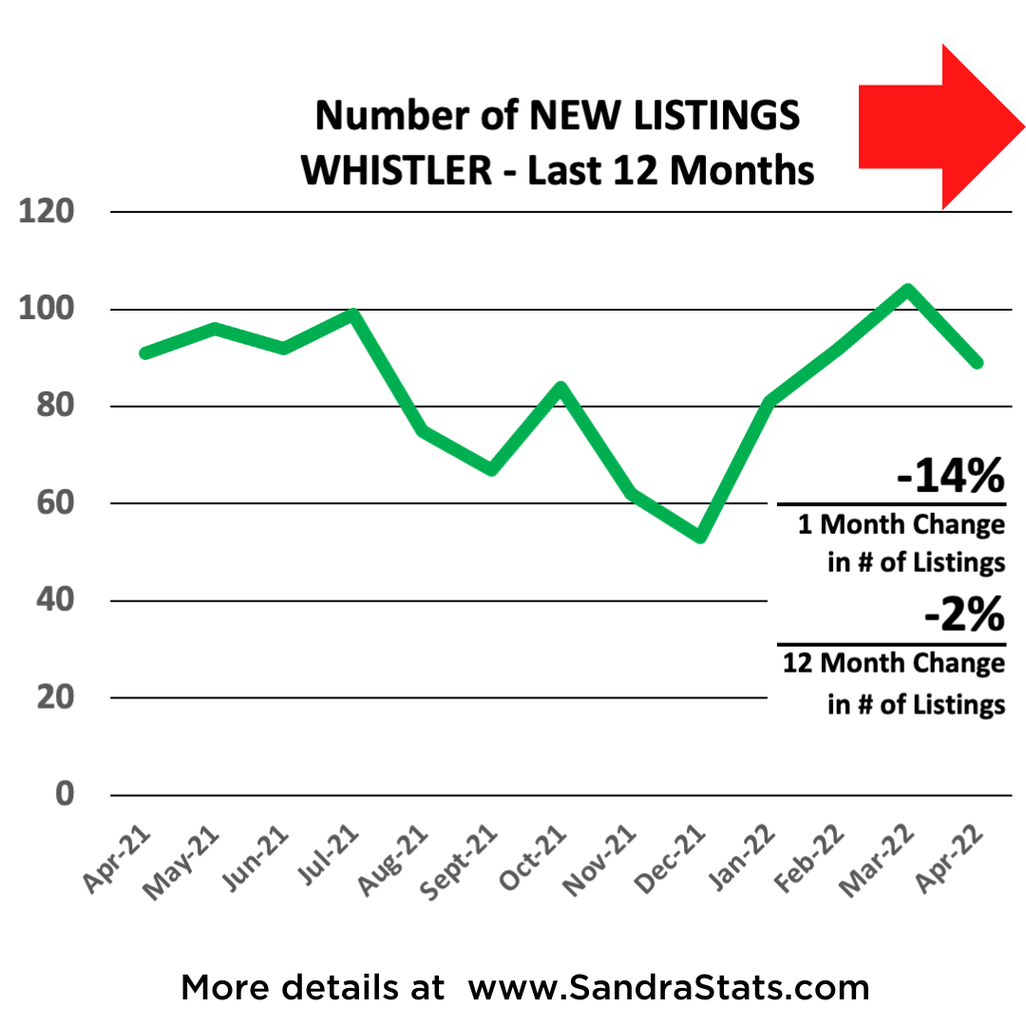
NEW LISTINGS:
Number of NEW listings saw a decrease over last month by 14% however once again you can see that there is no downward trend over the last 12 months.
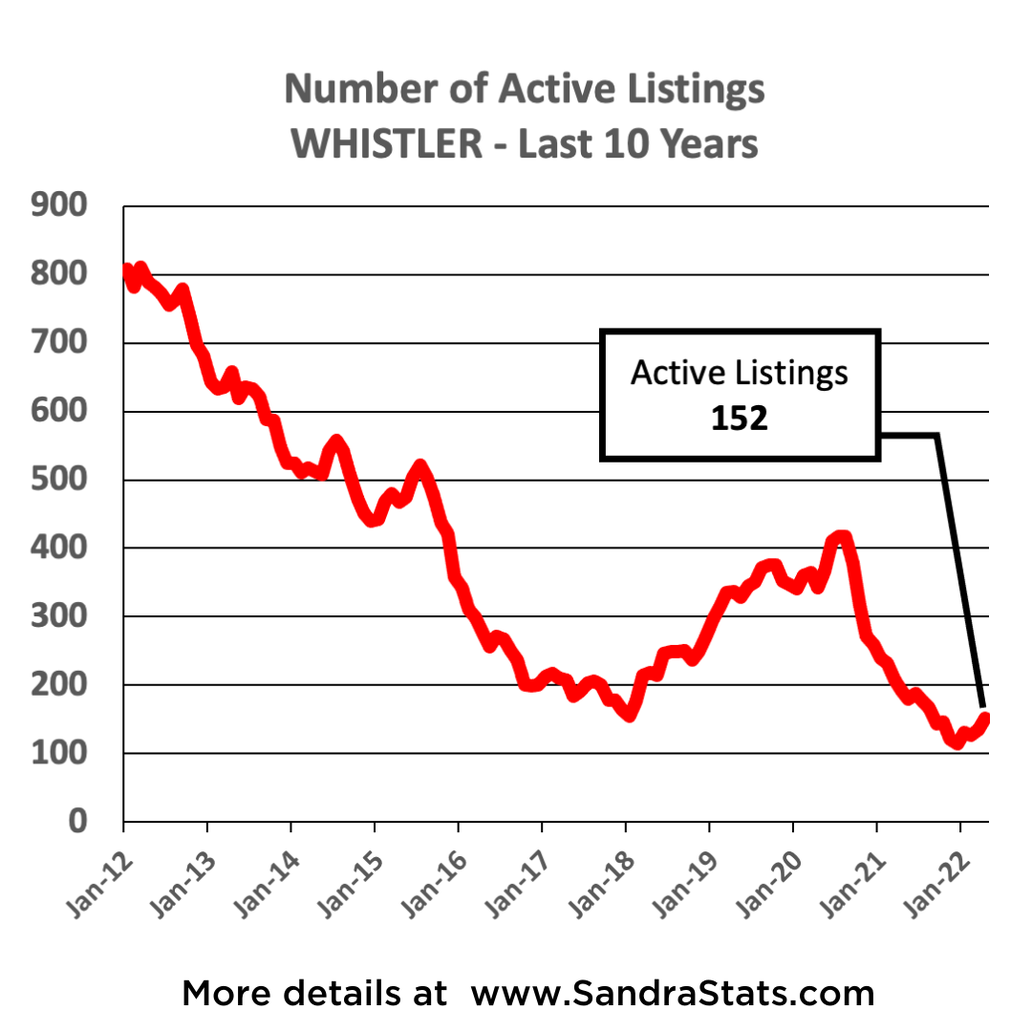
ACTIVE LISTINGS:
Total Active listings increased slightly however still remains at all time lows compared to the last 10 years.
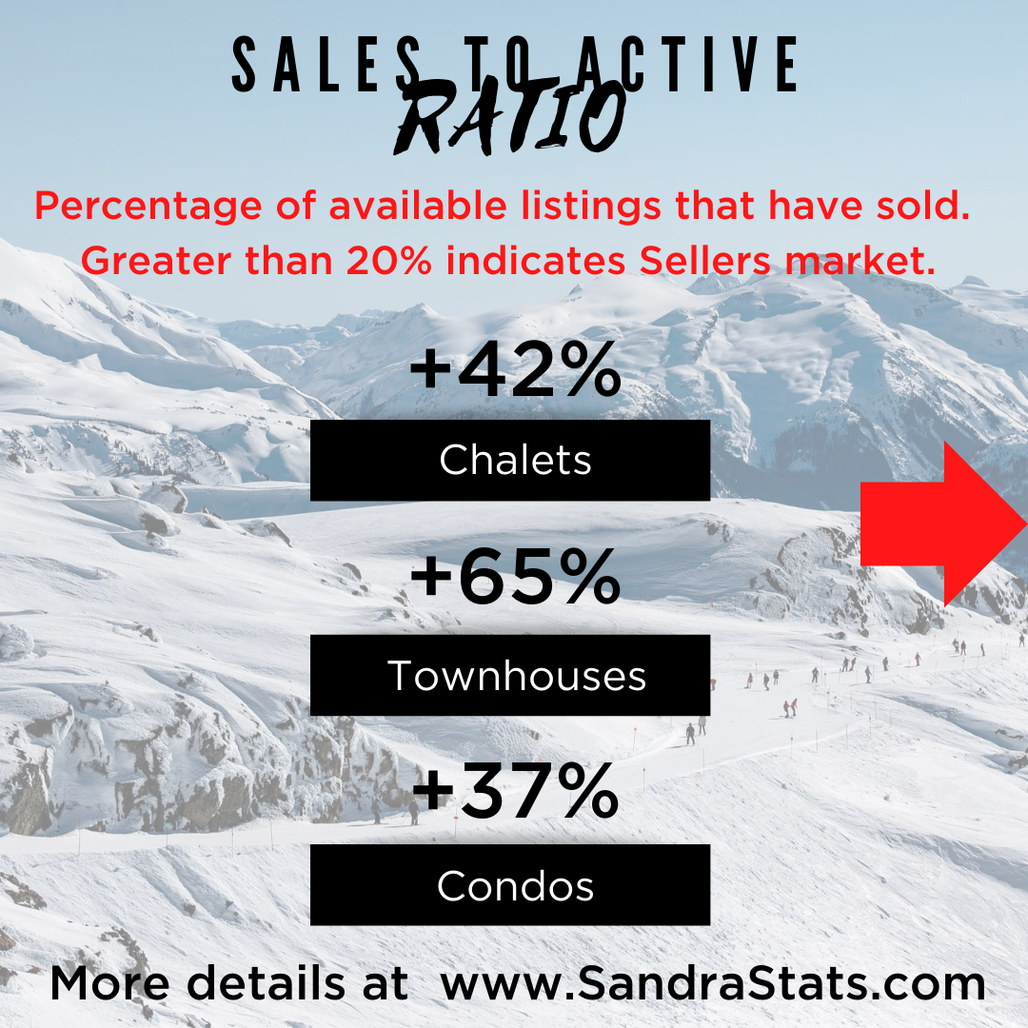
SALES TO ACTIVE RATIO:
Ranges from 37% - 65% across property types. This indicates that Whistler is still experiencing a SELLERS market.
Generally, analysts say downward pressure on home prices occurs when the SAR (Sales to Active Ratio) dips below 12 per cent for a sustained period, while home prices often experience upward pressure when it surpasses 20 per cent over several months.